Free shipping applies to orders over $900 and under 40lbs dimensional weight of the shipping box. Paint and replacement lamps are excluded. Free shipping is available to the contiguous 48 US states and for online purchases only.
ColorAnt is an easy-to-use tool that corrects an optimizes measurement data. The features include the ability to edit primary colors, substrate color and recalculate measurement data with the use of full sized test charts.
ColorAnt's main panel interface allows quick access to all tools from one easyto-use location. Icons display the purpose of each function on the panel.
What's New in ColorAnt 11?
Custom Chart - Improved user interface for more efficient test chart creation
Custom Chart - New Complementary Mini Chart for spot color libraries
Edit Primaries - New option to enter the target density for primary colors
Measure Tool - Support for the measurement device Barbieri Spectro Swing qb
Interaction of ColorAnt and ZePrA - Improved exchange of spot color libraries
Tone Value - TVI curves can now be adjusted to match the ISO 12647-2 standard
Additional Data Import Option - Easy creation of custom data files using Excel spreadsheets
Redesigned Preferences dialog - Define Report, Chart and Profile Directories
Highlights of ColorAnt
View Window - new channel filters allow better combination of individual channels (available in 2D and 3D View)
Compare Window - it is now possible to select the color distance formulas Delta-L, Delta-C, and Delta-H from the Compare Mode drop-down menu
Intersection Tool - extract identical color patches of two different test charts
Supports the newest standards, such as ISO 20654 (SCTV) or CxF/X-4
Custom Chart - create full CxF/X-4 wedge including black gradient
Two Idealliance charts have been added to the list of predefined charts
Patches from Image - allows creation of image-related test chart based on a loaded image
Proof Evaluation Tool - can be used to check whether the proof measurement data from a media wedge fulfills the requirements for a contract proof according to ISO 12647-7 or a validation print according to ISO 12647-8.
Command Line Interface (CLI)
Command Line Interface (CLI) - ColorAnt can now be controlled via the command line. It is intended for developers, scripters and experts and describes the usage of the command line interface of ColorAnt.
Note: The new CLI functionality is part of the new ColorAnt XL package.
The group
Data Import/Export - contains tools that beside loading existing measurement data files via the file menu allow to create measurement files.
Custom Chart - designed for creating the reference files for test chart generation. Custom Chart allows you to generate reference files for color spaces such as Gray, RGB, and CMYK. Creating
multicolor charts requires a
ColorAnt L license. Charts can have up to 15 channels. The new
Mini Charts are intended to complement profiling with spot colors via Edit Primaries, as there are more secondaries included in the chart.
Export Chart - allows to create test charts based on device color values, which can be stored as
TIFF or PSD files to be printed on a printer.
Measure Software - measure any test charts or media wedges via the
UPPCT software tool and transmit the measurement data directly to ColorAnt. There are multiple measurement instruments supported.
Report Tool - generates a comprehensive analysis of your measurement data in form of a
PDF or XML file. It also provides the user with corrective recommendations for such measurement
Embed CxF/X-4 - allows CxF/X-4 spectral information to be embedded in PDF documents
Save History Log - records every editing step, and saves all activities that have been applied to all files as a comprehensive PDF document
The actual tools to edit your measurement files are located in the
Editing group.
Redundancies - Corrects color patches by averaging the redundant patches and replacing with the same value.
Correction - detects faulty measurements or inconsistent measured values and replaces the data with expected measurement values.
Smoothing - Corrects inhomogeneous measurement data and non-smooth curves by interpolating existing smoothed data.
White/Black Correction Apply manual corrections to whitest color patch, typically the paper or other substrate. Black correction method can be used to change the darkest black, thereby scaling the entire dataset to the modified black point.
The
Brightener tool- adjusts the effect of optical brightening agents (OBA) on measurement data used in papers.
The
Tone Value tool - allows very targeted changes to the tone value increase (TVI) curves. The latest version introduces a fourth correction option, ISO 20654 (Multicolor), which only adjusts the multicolor channels to ISO 20654 and leaves the CMYK channels untouched. In addition, a Protect Lights slider has been added which helps users to leave the highlights untouched when applying G7 or ISO 20654 corrections.
The
Rescale tool - is an optional tool for re-sorting, making random test charts readable or also for rescaling to completely different test chart layouts.
Edit Primaries - is a very comprehensive tool to edit, exchange, add or remove primaries and the paper white point in your measurement data.
new Adopt Secondaries feature allows user to take advantage of color overprints with other primaries, such as secondary color data
Color Editor - edit color patches and process color conversions of spot colors
edit patch names, lab values (CIE), or device color values (DCS)
convert and optimize a complete spot color library to a target profile for RGB, CMYK, or Multicolor
Export data as Lab, XYZ, Density, ACV, XML and CxF/X-4
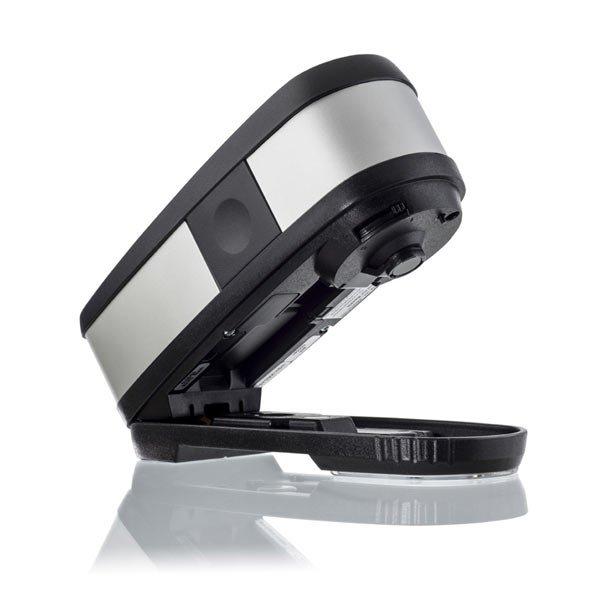
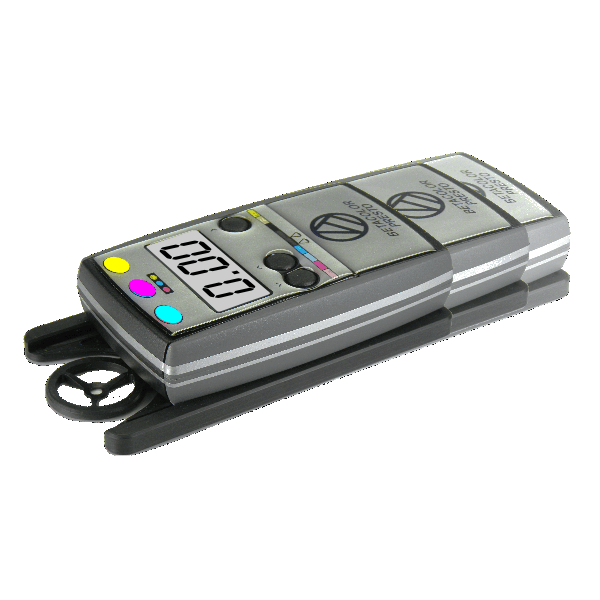
Supported Instruments
Barbieri Spectro LFP
Barbieri Spectro LFP qb
Barbieri Spectro Swing qb
Barbieri Spectropad
Konica Minolta FD-5
Konica Minolta FD-7
Konica Minolta FD-9
MYIRO-1
MYIRO-9
Techkon SpectroDens (Windows only)
Techkon SpectroJet (Windows only)
X-Rite eXact
X-Rite eXact 2 (XP)
X-Rite i1Pro 1
X-Rite i1Pro 2
X-Rite i1Pro 3
X-Rite i1iO
X-Rite i1iO 3
X-Rite i1iSis 2/XL
ColorLogic has developed an extensive portfolio and a line of first class color management technologies since being founded in 2002. Our team is continually encouraged to improve product quality and create new technology to solve day to day color management challenges in order to meet the high demands of the industry. We achieve this by working closely with our trusted partners to serve our common clients in the most effective way possible while addressing the continuously changing market requirement with innovative solutions.
Free Shipping
Free shipping applies to orders over $900 and under 40lbs dimensional weight of the shipping box. Paint and replacement lamps are excluded. Free shipping is available to the contiguous 48 US states and for online purchases only.
Fulfillment
We make every effort to get your product delivered as expediently as possible. Orders placed after 12:00 PM MST may not ship that day. RPimaging, INC may not have all items in stock. Our online store does not provide real-time stock availability. Please call to confirm stock before placing an order. Orders placed by international checkout button are fulfilled by FedEX Cross Border.
Domestic Shipping
RPimaging, INC does not guarantee any delivery time. Shipping terms (i.e. 2nd Day, 3rd Day delivery) refer to the time quoted by the shipper for delivery. These shipping terms do not refer to time from order submission to delivery. Shipper tracking numbers are provided, when available, the day after the product has shipped. Economy and Free shipping options are limited to the 48 contiguous US states. Freight shipment and packages over 40lbs are excluded from Economy and Free shipping offers. Customer purchase orders with payment terms are excluded from free shipping offers. We reserve the right to rescind Economy and/or Free shipping offers for any reason. Orders are shipped Free On Board (FOB) Origin unless otherwise noted.
International Shipping
Orders placed using the international checkout button are fulfilled by FedEX Cross Border.
All international packages are subject to relevant duties and taxes.
A refusal of the shipment will result in return shipping charges which will be deducted from any refund.
Typical delivery time is 2 - 5 days in transit depending on destination country.
Next Day delivery service is not available.
Date specific shipping is not available for international orders.
If you have any questions or need assistance, pleasecontact us.
RETURN POLICY:
If you are not happy, we are not happy.
We strive to ensure you are satisfied with your purchase but understand that sometimes it's not a good fit. Below are our policies:
No return will be accepted without a RMA (Return Material Authorization) number. Any return without a RMA number will be refused.
You are responsible for return shipping costs.
No refund or exchanges are allowed after 30 days from the invoice date.
Returns are subject up to a 20% restocking fee. Most of the time restocking fees are nominal.
All returned items must be 100% complete, in original resalable packaging, in resalable condition, with all packaging, manuals, registration cards, accessories, UPC codes intact, and software.
Software products that use a serial number and not a dongle key can only be replaced with the same title and version if found to be defective.
No returns on replacement light bulbs.
No returns on special order items not listed on our online catalog.
No returns or exchanges for any non-domestic shipments.
Shipping charges and order processing fees are not refundable. We recommend you select a shipping carrier that provides a shipment tracking option and insurance. Refusal of a shipment will result in return shipping charges which will be deducted from any refund.
RPimaging, INC reserves the right to refuse any return.
RPimaging, INC shall not be liable for any consequential or incidental damages arising from purchases from our online store.
Got Any Questions?
Contact Form
Fill in this form to have one our color experts reach out. We'll get back to you as soon as possible.
Live Chat
You can also utilize our Live Chat to contact us.
Phone
Alternatively, you can reach us toll free at
(866) RGB-CMYK—(866) 742-2695 or our local phone at
(520) 323-5855.
We are available 9:00AM - 5:00PM MST Monday - Friday.